602.616.4829 [email protected]

Valley Housing Report Shows Price Gains

According to a study by Metro Phoenix Housing Market Data and Analysis and RL Brown Housing Reports, the Valley’s residential sector is not only surviving, but also thriving — with no sign of a bubble.  “This is a solid-looking housing market… it’s the best it’s been in years,” said RL Brown, publisher of RL Brown Housing Reports.  “This is the kind of housing market consumers should be looking for — be they buyers or be they sellers. This is a steady, stable, but growing housing market on the resale side and the new home sale side,” Brown said.

The report states the region saw the most home permits and closing it has seen in the past 10 years for October.  New home sale prices were up 5.89 percent in October, accordign to the monthly report, with a median price of $332,186 on 1,651 sales for the month. Resale home prices were up 1.83 percent with a median price of $250,000 on 8,542 sales for October.  Data in the report shows the housing market is experiencing a steady increase, whereas a bubble typically comes after a rapid spike in sales and prices.

2019 Forecast: Existing-Home Sales to Stabilize and Price Growth to Continue

Consumers should expect home sales to flatten and home prices to continue to increase, though at a slower pace, according to a residential housing and economic forecast session at NAR’s 2018 REALTORS® Conference & Expo .

As Lawrence Yun, chief economist at the National Association of Realtors®, presented his 2019 housing and economic forecast, he was joined onstage by Lisa Sturtevant, President of Lisa Sturtevant & Associates, LLC, who discussed the importance of affordable housing in the U.S.

Much of Yun’s presentation focused on recent declines in home sales, but in the context of long-term trends to illustrate the housing market’s actual performance.

“Ninety percent of markets are experiencing price gains while very few are experiencing consistent price declines,” said Yun. “2017 was the best year for home sales in ten years, and 2018 is only down 1.5 percent year to date. Statistically, it is a mild twinge in the data and a very mild adjustment compared to the long-term growth we’ve been experiencing over the past few years.”

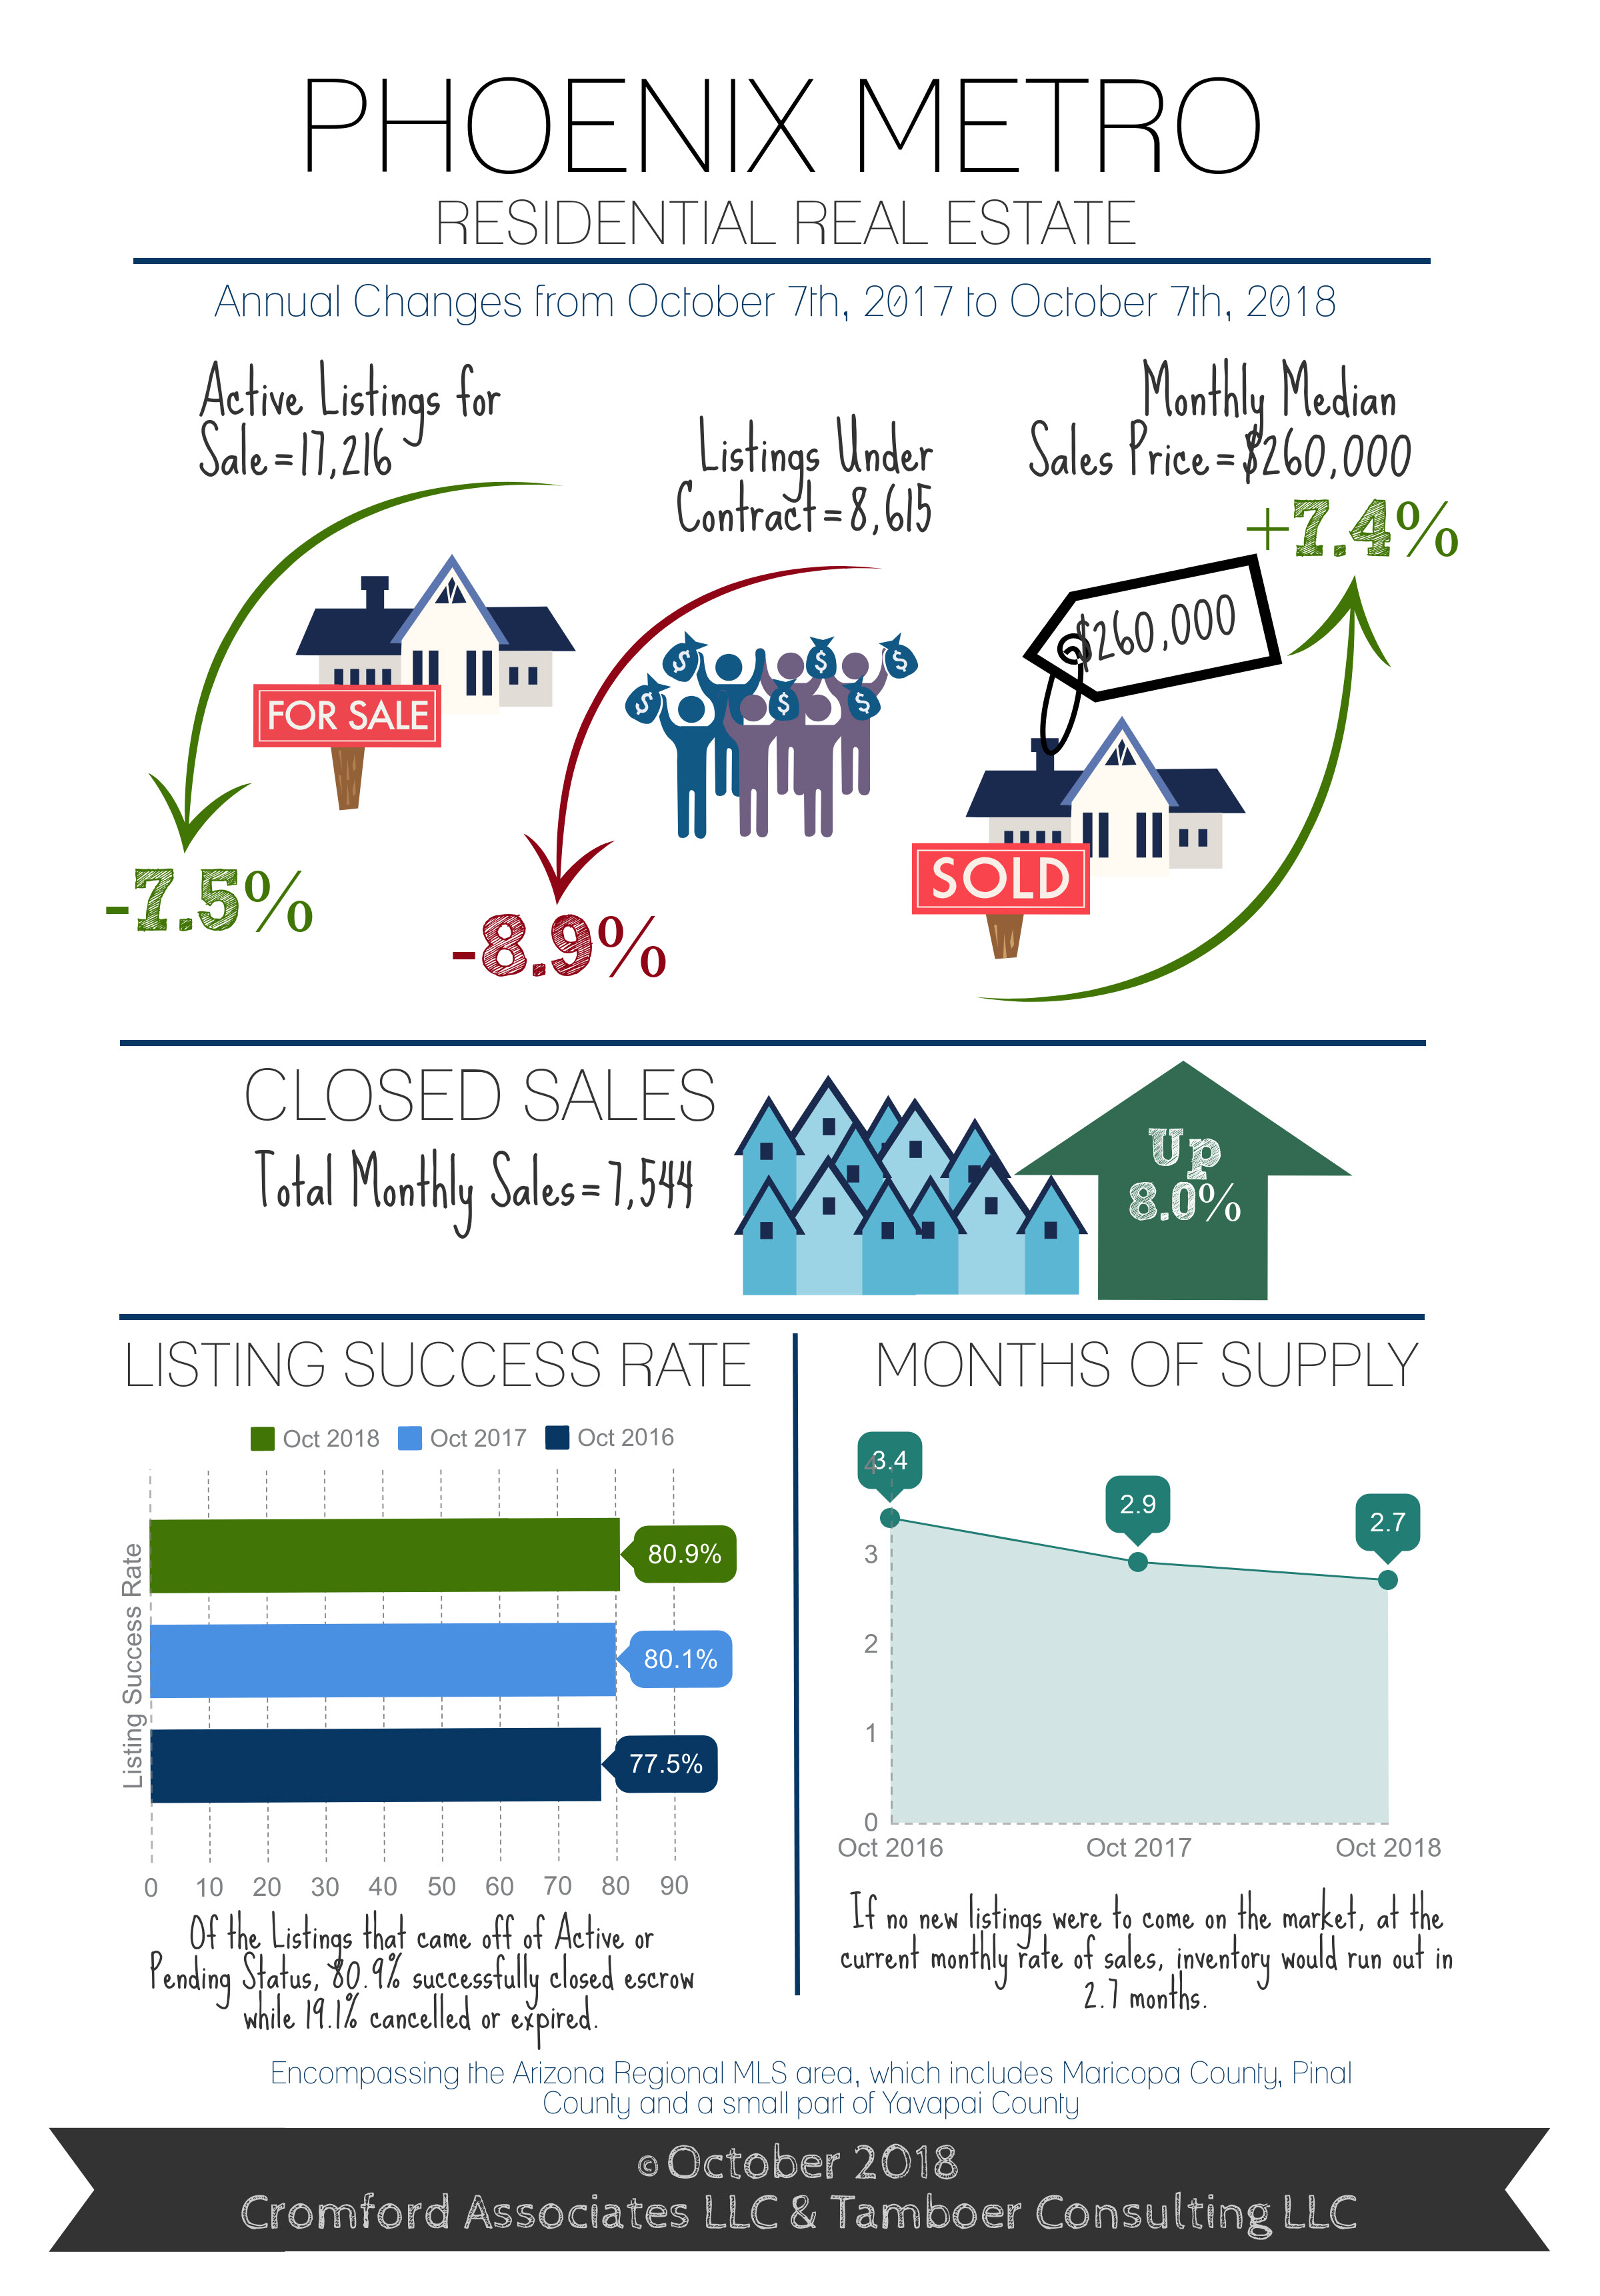
Phoenix Metro Housing Market Update: Year Over Year Comparison October 2018

Seller Concessions Spike on Listings Sold Between $200K-$250K
Price Reductions up 27% on Active Listings Between $250K-$400K

For Buyers:
October marks the 4th month in a row that supply has continued to rise between $200K – $400K, which is good news for many buyers as it provides them with more choice and fewer competing offers.  However, for those buyers with budgets under $200K, this trend in supply doesn’t apply to them and their choices are still extremely limited.  Last January, inventory under $200K made up 18% of all active listings.  Within that price range, single family homes made up 50%, condos and townhomes 30%, and mobile homes 20%.  As of this month, inventory under $200K only makes up 12% of actives and has declined 36% since January.  Single family homes make up 45%, condos and townhomes 36%, and mobile homes 19%.  This drop in supply equates to 591 fewer single family homes, 198 fewer condos and townhomes, and 229 fewer mobile homes available for sale under $200K since the beginning of 2018.

For Sellers:
When supply rises, sellers react in a number of ways to compete with one another for the existing buyer pool.  One option is a price reduction on their active listing prior to contract. This does not necessarily result in a decline in sale price, only a decline in sellers’ expectations for appreciation.  Sales price trends may still continue to rise, but perhaps only at 5% instead of 8%, for example.  Another option is to agree to a concession, such as paying a portion of closing costs or a home warranty; and finally to agree to a much lower sale price than what they were asking. Typically sellers agree to the first two options before submitting to a “low ball” contract, which is why sales price trends are the last measures to respond to a shift in supply and demand.  With that being said, weekly price reductions this month between $250K-$400K are up 27% compared to last year, while price reductions between $200K-$250K are only up 1.7%.  However, seller concessions on sales between $200K-$250K reached 41% so far this month compared to last quarter’s measure of 36%.  Only 21% of sales between $250K-$400K recorded a seller concession.  Which leads us to conclude that sellers below $250K are agreeing to more concessions than price reductions; while sellers over $250K are submitting to more price reductions.  Despite this slight weakening in sellers’ advantage, Greater Phoenix is not close to a balanced or buyer’s market so expect overall prices to continue rising over the next 3-6 months.

Commentary written by Tina Tamboer, Senior Housing Analyst with The Cromford Report
©2018 Cromford Associates LLC and Tamboer Consulting LLC

REALTORS® Expect Prices to Increase in Arizona

In a monthly survey of REALTORS®, respondents are asked “In the neighborhood(s) or area(s) where you make the most sales, what are your expectations for residential property prices over the next year?”

 Based on the responses of approximately 3,000 REALTORS® who answered this question in the August 2018 REALTORS® Confidence Index Survey, the median expected price change in the next 12 months nationally is 2.1 percent, a slower price appreciation compared to the 4.0 percent average during the January through May 2018 surveys (2.5 percent in July 2018 and 3.0 percent in August 2017).

The chart below shows the median expected price change across the U.S. states based on the June, July, and August 2018 surveys of REALTORS®.[1] The median expected price growth ranges from no change to five percent across the states.

REALTORS® who responded to the survey expect prices to typically increase in the state at four percent in Idaho, Nevada, Utah, Arizona, Alabama, and Delaware.  Read more…


Chandler Arizona One of the Top Cities for High-Earning Millennials

High-income millennials are the force behind a nearly 10 percent decrease in the amount of time homes spend on the market in the most popular areas of the country, according to a new realtor.com® report. Young adults are driving demand for homes in smaller, more suburban locales, and realtor.com® pinpointed the hottest ZIP codes which includes one in Chandler, Arizona.

“When it comes to choosing a home of their own, millennials are looking for opportunity, and they’re finding it in affordable suburbs,” says realtor.com® Chief Economist Danielle Hale. “These hot housing markets are attracting the attention of hard-working, high-earning 25- to 34-year-olds who are drawn by their relative affordability, strong local economies, and outdoor and cultural amenities.”

Read more